Chemotherapy for Colorectal Cancer
Sections on this page:
- Chemotherapies Included in the Models
- Historic and Projected Chemotherapy Utilization
- Model Inputs for Chemotherapy
- How the Effect of Chemotherapy is Modeled
Summary: learn what improvements in chemotherapy we modeled and how
There have been significant improvements in chemotherapy regimens for colorectal cancer (CRC) in the past decade, and based on national patterns of care studies the models can project the impact of increasing the use of chemotherapy on CRC mortality.
There are no Healthy People 2010 objectives for cancer treatment. Regardless, we wanted to determine whether better treatment could help meet the HP 2010 target for CRC mortality rates. There are two ways to achieve better treatment, using currently available chemotherapy modalities:
- Assure that everyone treated for CRC gets the best available chemotherapy at the time. Optimal treatment varies with stage of cancer at diagnosis and with age.
- Assure that everyone has access to chemotherapy. Currently, there are disparities in treatment based on race and age.
The model results show a small but significant effect of improving chemotherapy. Since we assume a rapid adoption of the two goals, these benefits occur immediately, and are the best short-term way to lower CRC mortality. The benefit remains relatively constant over time. Of course, it is likely that new therapy regimens are developed that will further reduce mortality—but we do not yet know how much these new regimens would effect CRC mortality.
Chemotherapies Included in the Models
There are four “eras” in CRC chemotherapy, based on the number of drugs approved and available for use with patients. This is not to imply that in the later periods, all the available drugs are used in one regimen. When available, one or more regimens may be used sequentially. In terms of predicting survival, the key predictor of prognosis is the number of treatments that were available to a patient based on the time period of diagnosis.
| Era | Description | Available starting in: |
|---|---|---|
| 1-drug | 5-fluorouracil (5FU) | prior to 1996 |
| 2-drug | irinotecan (brand name: Camptosar) | 1996 |
| 3-drug | oxaliplatin (brand name: Eloxatin®) | 2002 |
| 4-drug | antibodies cetuximab or bevacizumab | 2004 |
The newer drugs are used in regimens with 5FU and leucovorin (folinic acid), which enhances the effectiveness of 5FU. Effectiveness is measured by a hazard ratio which compares the death rate for patients receiving a given chemotherapy to the death rate for those receiving no chemotherapy. A hazard ratio of 1.0 indicates no benefit from chemotherapy; ratios less than one mean extended survival due to the regimen, with lower numbers indicating greater effectiveness. Hazard ratios depend on stage at diagnosis and age. We derived hazard ratios on the basis of review of all phase III clinical trials of chemotherapy for colon and rectal cancers published in English since 1970.
This chart shows the hazard ratios we used to compute risk of death from CRC, given various chemotherapy regimens. Note that effectiveness decreases for those 75 years of age and older, although chemotherapy still offers significant benefit. Note also that we use the same hazard ratio for stage II and III cancer. Although clinical trials for stage II disease have shown a trend towards benefit of chemotherapy, they have not been statistically significant. This may be an artifact of the highly favorable prognosis for stage II patients; it would take a very large number of patients to demonstrate a statistically significant improvement. Many stage II patients do get treatment, and all of the trials have had a trend in favor of treatment that just has not reached significance. Taking into account this positive trend, the low risk (comparable to that for stage I breast cancer patients, who regularly receive chemotherapy), and our biological understanding of the disease, we believe it is fair to go with the assumption that the relative benefit is the same for stage II and III.
| Chemotherapy | Stage II or III | Stage IV | ||
|---|---|---|---|---|
| < 75 years | 75+ years | < 75 years | 75+ years | |
| No chemotherapy | 1.00 | 1.00 | 1.00 | 1.00 |
| 5FU | 0.74 | 0.82 | 0.70 | 0.80 |
| 5FU + irinotecan | 0.60 | 0.70 | ||
| FOLFOX* | 0.61 | 0.71 | 0.50 | 0.60 |
| FOLFOX + antibodies | 0.42 | 0.46 | ||
* a chemotherapy regimen consisting of concurrent treatment with 5-fluorouracil, leucovorin, and oxaliplatin.
Historic and Projected Chemotherapy Utilization
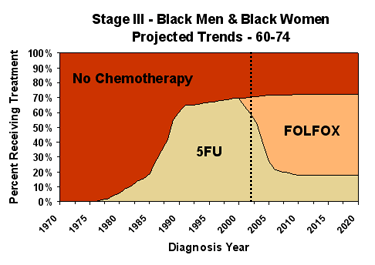
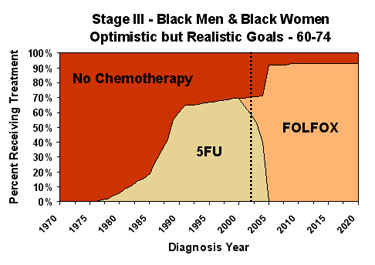
Area charts are used to show the distribution of chemotherapy types over time among patients diagnosed with cancer. They are drawn for a specific diagnosis and age-race group. Treatment type area charts for black males and females 60-74 years of age diagnosed with stage III CRC, under our projected trends and optimistic but realistic scenarios are shown below. (Area charts for various age groups and stages of CRC are available via the links in the first column of the table in the next section.)


On these charts, the red area shows the percentage of black men and women ages 60-74 diagnosed with stage III CRC in a given year and receiving no chemotherapy. The portion of each chart to the left of the dotted line is based on analyses of the SEER-Medicare linked dataset, extrapolated for patients aged less than 65 years at diagnosis based on Patterns-of-Care studies (see References and Data Sources for more information). The portions to the right of the dotted line are our scenario-specific projections.
In about 1980, chemotherapy became available for CRC and its usage with stage III patients steadily increased, reaching about 70% for this race and age group currently. Recently, the 3-drug regimen known as FOLFOX – for fluorouracil, leucovorin, and oxiliplatin – was approved and is becoming the treatment of choice.
Our modeling for the future is based on projections of patterns of use. The chart on the left above shows expected use, given past trends in adoption of new regimens. Our optimistic but realistic scenario assumes that we can maximize two aspects of chemotherapy utilization – all patients who could benefit from chemotherapy receive it, and everyone receiving chemotherapy gets the best treatment available. In the chart on the right, the sharp rise in FOLFOX use around 2005 represents the patients who could benefit from chemotherapy but would not receive it under the projected trend. The elimination of the 5FU regimen, in preference to the more effective FOLFOX regimen, around the same time means that everyone gets the best treatment available.
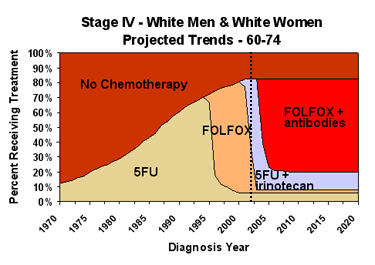
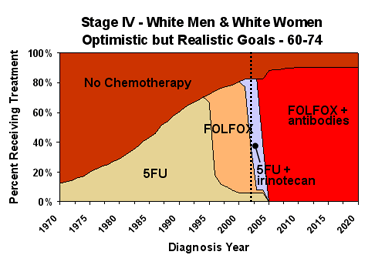
Area charts for stage IV cancer are based on the same principles but are more complicated because there are more treatment options.


To model “best available treatment”, we apply the lowest hazard ratio to all chemotherapy patients. To model “maximum diffusion of treatment”, we assume that chemotherapy is extended to everyone in the patient population who can benefit from it, increasing the total percentage receiving chemotherapy. Diffusion never reaches 100% of the patient population because chemotherapy is not appropriate for some patients, especially in older age groups. Because Healthy People 2010 does not have explicit objectives for chemotherapy, we use our optimistic chemotherapy assumptions, as described above, in the Healthy People 2010 scenario. Like the Healthy People 2010 objectives, these assumptions eliminate any disparity among race and sex groups.
We looked at “best available treatment” and “maximum diffusion of treatment” separately to try to determine whether one or the other approach has more impact. Because the results were too small to be reliable, we included only the combined effect in the interactive graphs section.
For more discussion of current trends in colorectal cancer chemotherapy, see the Treatment section of the Cancer Trends Progress Report.
Model Inputs for Chemotherapy
The following table shows chemotherapy model inputs in 2010 for each race/sex combination. Healthy People 2010 does not have specific objectives for colorectal cancer chemotherapy.
| Race/Sex Group (Click for graph of inputs projected through 2020) |
Chemotherapy* Input | 2000 Level | Level in 2010 | ||
|---|---|---|---|---|---|
| Projected Trends | Optimistic but Realistic | HP 2010** | |||
| * Average over all ages ** There are no Healthy People 2010 objectives for chemotherapy |
|||||
| -- for Stage II Cancer | |||||
| % not receiving chemotherapy | 52% | 50% | 47% | n/a | |
| % receiving 5FU | 48% | 15% | 0% | ||
| % receiving FOLFOX | 0% | 35% | 53% | ||
| % not receiving chemotherapy | 60% | 58% | 47% | n/a | |
| % receiving 5FU | 40% | 12% | 0% | ||
| % receiving FOLFOX | 0% | 30% |
53% |
||
| -- for Stage III Cancer | |||||
| % not receiving chemotherapy | 26% | 23% | 19% | n/a | |
| % receiving 5FU | 74% | 20% | 0% | ||
| % receiving FOLFOX | 0% | 57% | 81% | ||
| % not receiving chemotherapy | 37% | 35% | 19% | n/a | |
| % receiving 5FU | 63% | 16% | 0% | ||
| % receiving FOLFOX | 0% | 49% | 81% | ||
| -- for Stage IV Cancer | |||||
| % not receiving chemotherapy | 31% | 30% | 23% | n/a | |
| % receiving 5FU | 6% | 5% | 0% | ||
| % receiving 5FU + irinotecan | 63% | 1% | 0% | ||
| % receiving FOLFOX | 0% | 10% | 0% | ||
| % receiving FOLFOX + antibodies | 0% | 54% | 77% | ||
| % not receiving chemotherapy | 42% | 41% | 23% | n/a | |
| % receiving 5FU | 5% | 4% | 0% | ||
| % receiving 5FU + irinotecan | 53% | 1% | 0% | ||
| % receiving FOLFOX | 0% | 8% | 0% | ||
| % receiving FOLFOX + antibodies | 0% | 46% | 77% | ||
How the Effect of Chemotherapy is Modeled
Colorectal cancer (CRC) treatment depends on the stage at which the cancer is diagnosed. If the tumor is caught at early stages (localized) it can be curable. Surgery is typically the primary treatment, supplemented by chemotherapy. When CRC has spread (metastasized), surgery may not be an option and chemotherapy is often the primary treatment. The simulations model prolonged life due to chemotherapy for both early stage and late stage CRC.
A simulated person with undiagnosed CRC has a chance of having the CRC discovered each year. The chance of discovery due to “symptoms” increases with each cancer stage. CRC can also be diagnosed by screening.
The probability that a simulated person with a new diagnosis of CRC receives chemotherapy is modeled as a function of stage at diagnosis, age, sex, race and calendar year and is dependent on the scenario being run.
CRC has the potential to cause death earlier than it otherwise would have occurred. Chemotherapy decreases that chance according to the published hazard ratio for that type of chemotherapy. In some cases, life is extended enough that the individual dies of other causes, and therefore does not contribute to the CRC mortality rate.

