WUMM-DES Washington University School of Medicine in St. Louis
In the CISNET Multiple Myeloma Incubator Program, the Washington University Modeling Group has constructed and calibrated a discrete event simulation (DES) tailored to model the natural history of multiple myeloma (WUMM-DES), from no disease, the pre-malignant condition (i.e., MGUS) development, progression of MGUS to multiple myeloma, and death for the U.S. population aged 20 years or older. The developed WUMM-DES can be tailored to set research priorities and design clinical trials, including assessing sample sizes and power, evaluating the impact of treatment adherence of the participants, and determining the optimal treatment strategies. It can also be used to predict trial results and set policy goals.
Contact: Su-Hsin Chang, PhD, SM chang.su-hsin@wustl.edu
Overview
The Washington University modeling group in the CISNET incubator program has constructed and calibrated a discrete event simulation (DES) to model the natural history of multiple myeloma (MM). The model’s name is Washington University Natural History of Multiple Myeloma Model – Discrete Event Simulation (WUMM-DES).
The WUMM-DES models the natural history of MM with a lifetime horizon. DES models the operation of a system as a discrete sequence of well-defined events in time. It is a common modeling method, due to its simplicity, efficiency, and flexibility, (e.g., no fixed cycle length, ability to manage multiple events simultaneously and to allow interactions between individuals). Due to the long progression time, DES is an appropriate modeling technique to model the natural history of MM.
The model starts with a healthy U.S. population aged 20 years or older (see Figure 1 for the model scheme of WUMM-DES), among whom some develop MGUS (a premalignant condition of MM) and others remain without MGUS until death. Among those who develop MGUS, some progress to MM, while others may not progress in their lifetimes. The population is stratified by race/ethnicity and sex into four populations: non-Hispanic Black men and women as well as non-Hispanic White men and women.
WUMM-DES

Figure 1: WUMM-DES model scheme.
The parameters of the WUMM-DES are based on real-world data. The probabilities and time-to-event distributions for disease progression are contingent upon individual demographics, recognizing the inherent heterogeneity among individuals. Several data sources were used, including the National Health and Nutrition Examination Study (NHANES), Surveillance, Epidemiology, and End Results (SEER) and related software, Veteran Health Administration (VHA), and the Centers for Disease Control and Prevention (CDC) life tables.
The current version of the WUMM-DES assumes no factors other than age, race/ethnicity, and sex influence the disease progression and survival. Currently smoldering MM (sMM), a more advanced pre-malignant disease than MGUS, is not included in the WUMM-DES. Furthermore, WUMM-DES does not consider undiagnosed MGUS/MM or access to healthcare. Last, the maximum age for individuals is capped at 100 years.
Monte Carlo simulations were performed using a hypothetical subpopulation aged 20 years with a size of 100,000 and run through the WUMM-DES until all individuals died or reached their maximum life expectancy. The model parameters were further calibrated by minimizing the difference between the model simulated MGUS prevalence and MM incidence with the observed MGUS prevalence data from NHANES and MM incidence data from SEER.
Model outputs included MGUS prevalence (Figure 2), MM incidence (Figure 3), life expectancy (Figures 4-5), and life years lost associated with MGUS and MM (Figures 4-5) stratified by race and sex.
MGUS prevalence
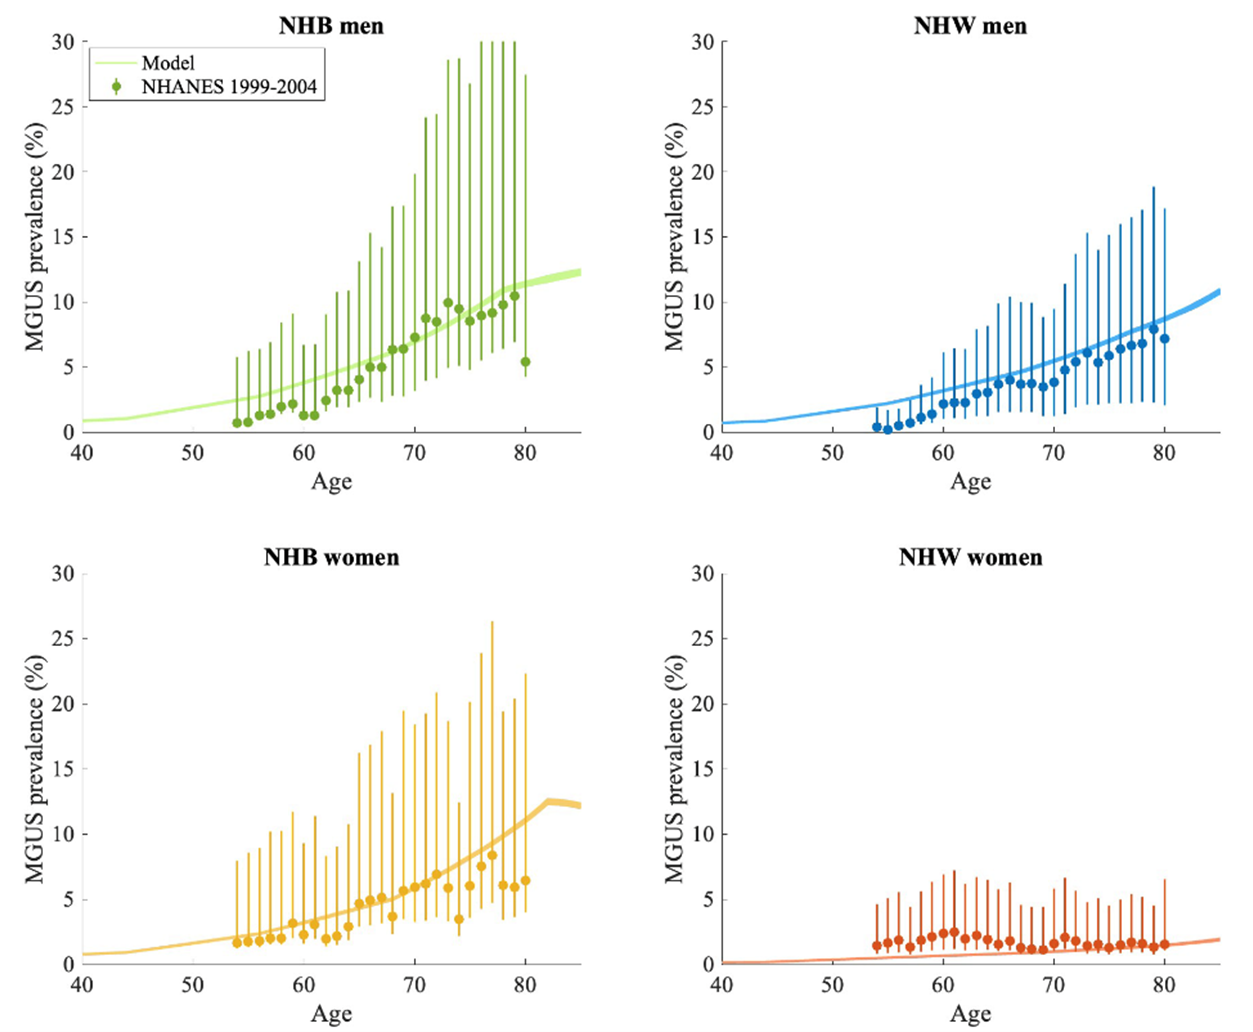
Figure 2: MGUS prevalence for Non-Hispanic Black women and men, Non-Hispanic White women and men: calibrated data and 95% CI versus data estimated from NHANES 1999-2004.
MM incidence

Figure 3: MM incidence for Non-Hispanic Black women and men, Non-Hispanic White women and men: calibrated data and 95% CI versus data obtained from SEER 2013-2018.
Life expectancy after MGUS diagnosis
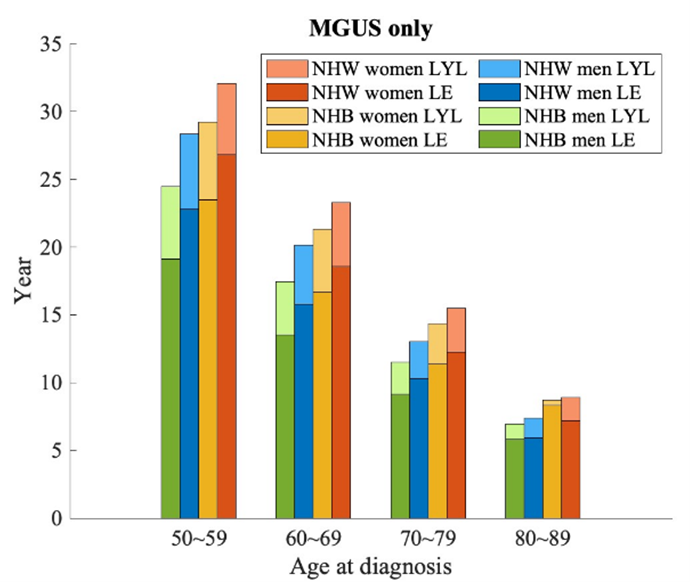
Figure 4: Life expectancy (LE) and life years lost (LYL) for Non-Hispanic Black women and men, Non-Hispanic White women and men after MGUS diagnosis.
Life expectancy after MM diagnosis
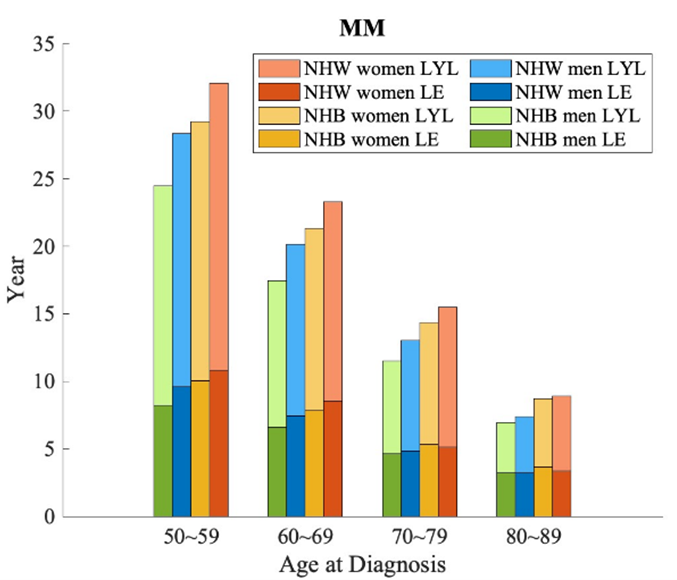
Figure 5: Life expectancy (LE) and life years lost (LYL) for Non-Hispanic Black women and men, Non-Hispanic White women and men after MM diagnosis.
Bladder models
- Kystis (Brown) Brown
- COBRAS (Ottawa) Ottawa
- SCOUT (NYU) NYU
Bladder Model Comparison Grid (PDF, 145 KB)
See all Comparison Grids & Profiles (Includes historical versions)
Lung models
- BCCRI-LunCan (BCCRI)
- BCCRI-Smoking (BCCRI)
- LCOS (Stanford)
- LCPM (MGH)
- MISCAN-Lung (Erasmus)
- SimSmoke (Georgetown)
- Smoking-Lung Cancer (Georgetown)
- MULU (Mount Sinai)
- ENGAGE (MDACC)
- YLCM (Yale)
- OncoSim-Lung (CPAC-StatCan)
- LMO (FHCC) (Historical)
Lung Model Comparison Grid (PDF, 161 KB)
See all Comparison Grids & Profiles (Includes historical versions)